

METEOROLOGY—PART I (GENERAL)
Contents:
Land and Sea Breezes
Radiation and Advection Cooling
Using Lapse Rates to Predict Cloud Height and Freezing Level
The Atmosphere
The term "atmosphere" referrs gernally to the area extending from the ground 50 miles AGL composed of 78% nitrogen and 21% oxygen. A square-inch column of atmosphere usually weighs 14.7 lbs. at sea level, and 6.75 lbs. at 20,000 feet.
The atmosphere is composed of four layers

Troposphere
-
from the ground to approximately 28,000’ near the Poles and 54,000’ near the Equator;
-
contains most “weather” with pressure, density and temperature varying rapidly with height;
-
top layer is known as tropopause, where the temperature reaches a constant -56°C.
Stratosphere
-
extends approximately 9 miles beyond the tropopause; water vapour is non-existent and air currents are minimal. The temperature with the stratosphere initially increases with height to between 0° and 10° C. owing to the presence of ozone; beyond the ozone layer, temperature again decreases with height, eventually reaching -100° C.
Mesosphere
-
In the Mesosphere the temperature simply decreases, eventually reaching -100 C. This is the coldest point in the atmosphere—referred to as the mesopause.
Thermosphere
-
extends from 50 miles to 250 miles above the earth;
-
temperature begins to rise again to reach 3000°C. from the solar rays that are encountered in a vacuum;
-
auroras (Northern Lights) occur, as well as the ionosphere (free electron density) which reflects low and medium frequency waves (but not VHF).
Standard Atmosphere
The concept of a standard atmosphere is to to make calculations and predictions about the atmosphere, based on the assumption of standard conditions—these condition are referred collectively as the standard atmosphere, and is often referred to as as ICAO Standard Atmosphere (International Civil Aviation Organization), or ISA for short.
ISA Conditions
The ISA standards are based on conditions at mid-lattitudes—the 40th parallel—and are as follows:
-
15°C.;
-
Sea Level ambient air pressure 29.92 inches of mercury (“Hg.), or 1013.2 milibars;
-
Temperature Lapse Rate of 1.98°C. per 1000’ increase in altitude (used throughout the world);
-
Dry air.
Saturation Point
Clouds form visually when air is cooled reaches its saturation point whereby invisible water vapour becomes visible moisture.
Clouds
Condensation and Sublimation
When the saturation point results in the appearance of water droplets, the process of referred to as condensation; when the saturation point produces ice crystals, the process is referred to as sublimation (also know as deposition).
Cloud Classification
Clouds are classified on the basis of shape—or form—and height.

Cloud Forms
-
cumulus clouds are fluffy-cotton shaped, and indicate rising, unstable air;
-
stratus clouds are flat, layered clouds, indicating stable air;
-
nimbus clouds are clouds that emit rain or snow.
Cloud Heights
-
High Clouds (16,500’- 45,000’; ice crystals): Cirrus (Ci), thin wavy wisps, “mares’ tails”; Cirrocumulus (Cc), “mackerel sky”; Cirrostratus (Cs), thin “sheet” of cloud, producing “halo” around the sun, often indicating an approaching warm front.
-
Middle Clouds (6,500’- 23,000’; ice crystals, water droplets, or supercooled water droplets): Altocumulus (Ac), a layer or series of rounded cloud masses that sometimes indicate an approaching front (Altocumulus Castellanus (Acc) are large turret-shaped Ac, associated with icing and turbulence); Altostratus (As), a thick, grey cloud veil, often indicating an approaching warm front (the cloud slopes downward toward the front).
-
Low Clouds (surface - 6,500’; ice crystals, water droplets, or supercooled water droplets): Stratus (St), uniform thick cloud, like airborne fog, sometimes producing drizzle; stratus that is broken up by wind is Stratus fractus; Stratocumulus (Sc), layer or series of rounded or rolling cloud; Nimbostratus (Ns), dark thick stratocumulus producing uniform rain or snow.
Vertical development of cloud
-
Cumulus (Cu): dense “cotton balls” with flat bases and rounded tops; appear at the warm time of day and dissipate at night; when associated with ragged fragments, they are called cumulus fractus (Cf); smooth air above, bumpy air below.
-
Towering Cumulus (Tcu): developed from cumulus clouds and usually develop into cumulonimbus; rough air below them, and smooth air on top; associated with heavy icing.
-
Cumulonimbus (Cb): developed towering cumulus that extend above freezing level; cloud summits form anvil shape; heavy precipitation with hail and lightning; often in a line in association with a cold front; can be embedded; avoided by all pilots because of turbulence and icing.
Sky Opacity
Sky opacity—that is, the amount of sky visible in relation to the presence of cloud layers—is described on the basis eighths or “oktas.” Clear: no clouds; few: 1/8 to 2/8 sky cover; scattered: 3/8 to 4/8; broken: 5/8 to 7/8; overcast: 8/8.

Cumulative Cloud Opacity
Note that the opacity of multiple cloud layers is cumulative—for example, the higher of two scattered layers, each of which is composed to 3 oktas, is actually classed as “broken” (3/8 + 3/8 = 6/8). This will be reviewed later in Weather Information.
Pressure
Inches of Mercury
Atmospheric pressure is measured by a mercury barometer and is expressed in inches of mercury (“Hg); pressure generally varies between 27.76 and 31.27 “Hg. Pressure decreases with an increase in altitude at a rate of approximately 1“Hg per 1000'.
Station Pressure
Station pressure is the raw pressure at an observing station.
Mean Sea Level Pressure
Mean Sea Level (MSL) Pressure reduces all station pressures to a standard corrected for altitude; it is used for weather analysis.
Altimeter Setting Pressure
Altimeter Setting Pressure (ASP) is similar to MSL pressure, except that it is based on standard sea level temperature of 15 C and a standard lapse rate of 1.98°C. per 1000 ft. When ASP is dialled in on an altimeter at ground level, elevation is indicated.

Pressure Isobars
On weather maps, areas of equal pressure are joined by isobars. Isobars never cross, but show areas identified as lows, secondary lows, troughs, highs, ridges and cols. These pressure systems constantly change. Most systems move in a west to east direction.
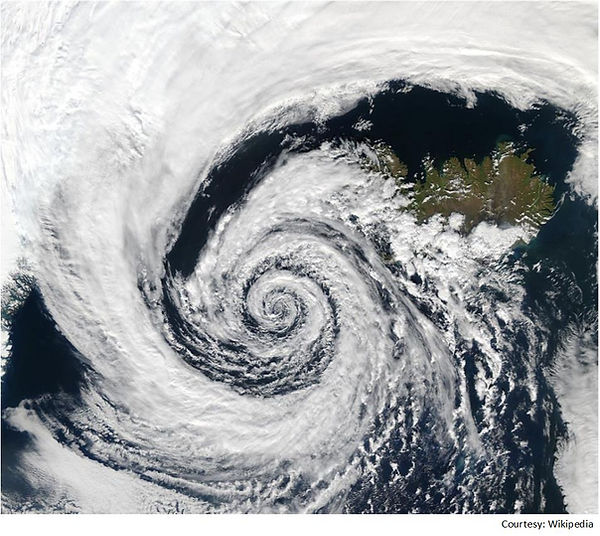
Low Pressure
Lows are also called cyclones or depressions ; they are low pressure areas that vary in size (from country to continent) and move an average of 500 miles per day in the summer, and 700 miles per day in winter; they drift usually in a north-eastward or south-eastward direction, circulating in an anticlockwise direction (clockwise in the southern hemisphere).
Secondary Low
Secondary Lows are smaller low pressure disturbances in larger low systems, circulating around the larger system in an anticlockwise fashion.
Trough
A trough elongated u-shaped area of low pressure with higher pressure on either side. (Note: “trough” also means the V-shape associated with frontal systems.)
Col
A col is a neutral region between two highs and two lows; an area of unsettled weather.
High
Highs are also referred to as anti-cyclones; they are areas of high pressure, with the highest pressure in the middle; they are associated with fair, clear weather; they move slower than lows.
Ridge
A ridge is an elongated high with low pressure on either side.
Coriolis Force
Let's begin with a brief video produced by NOVA PBS:
Winds blow from high pressure to low pressure; the higher the pressure gradient, the higher the winds at the surface and aloft.
However, because the earth is rotating, the movement of air is deflected to the right; high pressure therefore circulates in a clockwise fashion while low pressure circulates anti-clockwise. Movement is the reverse in the Southern Hemisphere. The force that is exerted is referred to as the coriolis force, while the right and left deflection—reversed in the Northern and Southern Hemispheres—is known as Fennell's Law.
Another force affecting wind is surface friction; at the surface, the movement of the air slows, and the coriolis force is reduced.
End result: air moves across isobars with a slight angle inward toward low pressure (convergence) and outward from high pressure (divergence). Above 3000’ AGL, the winds blow parallel to the isobars (no surface friction).
If you stand with your back to the wind, the low-pressure area will be on your left side—this is referred to as Buys Ballot’s Law.
Local Phenomenon Winds

Land and Sea Breezes
Since land heats up and cools off faster than water, a sea breeze (from sea to land) blows during the day, and a land breeze (land to sea) blows at night.
Mountain Winds
Valley walls cool at night, causing down-slope breezes (katabatic wind—a mneumonic for this is 'Kool Kat"—katabatic), while warm valley walls in the day cause up-slope breezes (anabatic wind).
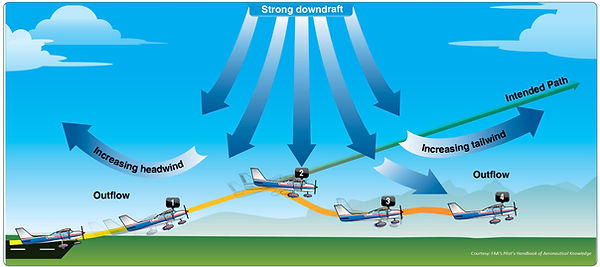
Mountain Wave
Mountain Waves are powerful patterns of air turbulence found on the leeward side of mountains in windy conditions. They are hazzardous for light aircraft. Downdrafts of 2000’ per minute are common and can be as great as 5000’ per minute. The downdrafts occur along the leeside and are most severe at summit height. The visual indicators of mountain wave activity are cap clouds on the mountain tops, rotor clouds on the leeside below the peak level, and lenticular clouds high above the rotor cloud. The more perpendicular the winds to the mountain range, the more violent the turbulence; the most severe turbulence is found between the rotor cloud tops and the ground.

The above depiction shows the positioning of the identifying clouds associated with mountain wave activity. Note the location of the strongest downdrafts, on the leeward side of the mountain or cap cloud. Note also the location of the very severe rotor cloud turbulence located downwind of the mountain at peak level—sometimes positioned below lenticular cloud formations.
Below is an excellent time lapse of rotor cloud movement by Basehunters Chasing:
Mechanical Turbulence
Mechanical turbulence is turbulence in the wind created by surface features (hills, buildings, etc.).
Veering and Backing Winds
Veering and backing winds are discriptive terms for changes in wind direction, and are used to describe patterned wind changes near the surface of the earth. Winds veer when they rotate in a clockwise fashion, and back when they rotate anticlockwise; when descending to land the wind will back and decrease owing to surface friction (see above); at night the winds back and decrease, and in the day they veer and increase.
Wind Sheer
Wind sheer: a sudden change in wind speed and/direction that can occur along the horizontal or vertical. Frontal wind sheer can occur if the temperature change is greater than 5°C., or if the front is moving in excess of 30 KTS. A gust sheer can occur as much as 10 miles ahead of a thunderstorm, producing wind speeds in excess of 100 KTS. Temperature inversions associated with night-time cooling causes wind sheer near the top of the inversion, especially in association with a low-level jet stream.
Space
Humidity
As discussed earlier, cloud formation occurs when invisible water vapour becomes visible, either as water droplets (condensation) or ice crystals (sublimation).
Every air mass is limited in the amount of moisture it can hold; when this limit is reached—referred to as the saturation point—condensation or sublimation will occur.
The amount of moisture an air mass can hold is dependent on temperature: the warmer the air, the more moisture it can hold. For every 11ᵒ C. increase in the temperature of a parcel of air, its capacity to hold moisture doubles.
Relative Humidity is the ratio of water vapour in the air relative to the saturation point (saturated air has 100% RH). As air is cooled its ability to hold invisible moisture decreases; the temperature to which unsaturated air must be cooled to become saturated (at constant pressure and humidity) is called the dewpoint. The smaller the spread between temperature and dewpoint, the higher the relative humidity. Fog or cloud usually forms when the spread is within 2°C. Here is a very short video produced by the American Owners and Pilots Association:
Space
Supercooled Water Droplets: Water droplets can remain in a water state as low as -40°C., and are commonly found in cloud with temperatures between 0° and -15°C. When these droplets strike an airframe, severe icing can occur.
Heating
The troposphere is heated from below from the earth’s surface by radiation (terrestrial radiation). Specifically, we identify four processes:
Isotherms
Isotherms are found on meteorological maps and are lines joining areas of equal temperature.
Cooling
Temperature Lapse Rate
Since the troposphere is heated from below, temperature decreases with increased altitude; the rate of decrease is called the lapse rate. The lapse rate is 2°C. per 1000’ (specifically, 1.98°C).
Radiation and Advection Cooling
The earth’s surface cools at night as heat is lost by radiation—radiation cooling . When warm air moves over a cool surface, the decreased temperature of the air is advection cooling.
Adiabatic Process
Lets begin with a brief video by the University of Wyoming:
As air rises, it expands and cools; this is called the adiabatic process. Two adiabatic lapse rates are used: the dry adiabatic lapse rate, which is 3°C. per 1000’, and the saturated adiabatic lapse rate, which is 1.5°C. per 1000 ft. Why are two adiabatic rates used? The dry adiabatic rate is used for dry or clear air, while the saturated adiabatic rate (also known as the or “wet” or “moist” adiabatic rate) is applied to the rate of cooling that occurs with increased altitude in cloud (saturated air). Here is the difference: the adiabatic lapse rate is less in saturated air because the transformation process from gas to water actually releases heat—referred to as the latent heat of vaporization—into the surrounding air, so the adiabatic lapse rate for saturated air is less because of this added heat.
Using Lapse Rates to Predict Cloud Height and Freezing Level
You would think that the Dry Adiabatic Lapse Rate of 3ᵒ C per 1000’ would be used to predict the base of clouds—i.e., take the temperature and dewpoint spread at the surface and divide this by the 3ᵒ C. Importantly, though, it isn’t quite the straight forward, as well the temperature lapse rate is predictable, the change is dewpoint is not—in fact, the dewpoint also falls as air rises, falling at a rate of .5ᵒ C per 1000’. The result is we have to more accurately speak of a temperature/dewpoint convergence rate of 2.5ᵒ C per 1000’ (3ᵒ - .5ᵒ = 2.5ᵒ).
For example, then, if you want to predict the base of clouds, and the temperature is 20ᵒ C, while the dewpoint is 15ᵒ C, the cloud base could be estimated at 2000’—that is, 20ᵒ - 15ᵒ = 5ᵒ, then 5ᵒ ÷ 2.5 (convergence rate) = 2, or what is 2000’.
With respect to the Saturated Adiabatic Lapse Rate, there is no modification for convergence, so the freezing level can be predicted by taking the temperate at the base of the cloud and, if it is above freezing, divide this number by the Saturated Adiabatic Lapse Rate of 1.5ᵒ C per 1000’—that is, 15ᵒ C (the dewpoint) ÷ 1.5ᵒ = 10, or what equates to 10,000’. Importantly, this must be added to the height of the cloud base (saturated air), so 10,000’ + 2,000’ (the predicted cloud base) = 12,000’.
Space
Stability
-
It is useful to differentiate between two types of air masses: stable and unstable.
-
Stable air resists vertical movement, and when displaced returns to its original horizontal level; unstable air moves further up and down when disturbed.
-
Why is this important? Unstable air produces turbulence and thunderstorms.
-
Air expands as it rises owing to a decrease in ambient pressure. When expansion of air takes place, the air is cooled. This is the adiabatic process. If the rising air cools to a temperature equal to its surrounding air, stability will occur and it will stop rising; if, however, the rising air remains warmer than the surrounding air, it will continue to rise. Here are videos by Gigi Richards (left) and jwm3434 (You Tube handle):
-
The main indicator of air stability is therefore the specific temperature lapse rate of an air mass—referred to in meteorology as the environmental lapse rate (so as to differentiate the existing temperature lapse rate from the dry and saturated adiabatic lapse rates). Rule: A steep lapse rate creates instability, and a shallow lapse rate creates stability.
-
Advection (cooling) therefore causes a steepening of the lapse rate and creates instability, while an isothermal layer (layer with constant vertical temperature) or an inversion (reversed lapse rate) causes stability. Below are two videos that discuss inversions, by Duane Friend (left), and US National Weather Service:
-
Lifting agents which create vertical movement of air:
Here is a final video by Gigi Richard.